Mileage Expenses Dashboard Analysis
The Mileage Expenses dashboard provides comprehensive insights into an organization's car travel related expenses, enabling effective monitoring and fraud prevention measures.
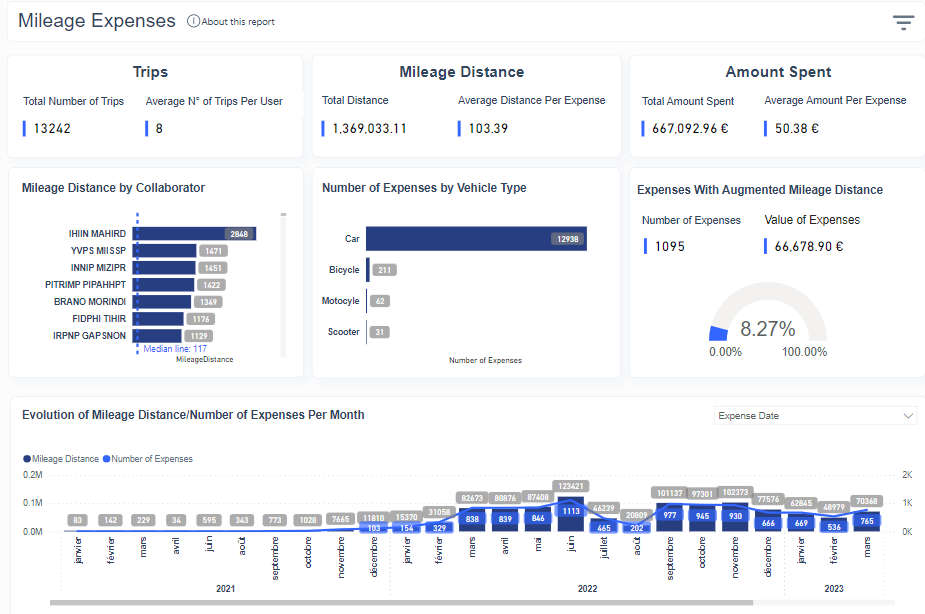
Key Metrics
Overview of expenses with
- Total and average number of trips
- Total distance covered
- Total amount spent on mileage expenses
Employee Breakdown:
A list of employees who have submitted mileage expenses, allowing for individual analysis and identification of potential outliers.
Expense Evolution:
A visual representation of the evolution of mileage expenses over time, facilitating the detection of anomalies or sudden spikes in spending.
Vehicle Types:
An overview of the types of vehicles most commonly used by employees for business travel, providing insights into potential cost-saving opportunities or policy adjustments.
Expense Alternation Analysis:
A radar chart displays the percentage of expenses that have been manually adjusted or inflated, potentially indicating fraudulent behavior. This feature aids in identifying employees who may be manipulating mileage logs for personal gain.
By consolidating and visualizing mileage expense data, this dashboard empowers organizations to maintain tight control over car travel costs. It enables managers to identify patterns, detect potential fraud, and take corrective actions, such as implementing stricter policies or providing additional training to employees.