Expensya Insights dashboards Basics with Expensya
- Expensya Insights dashboards Elements:
Everything you do in Expensya Insights dashboards can be broken down into a few basic building blocks.
Here are the basic building blocks in Expensya Insights dashboards:
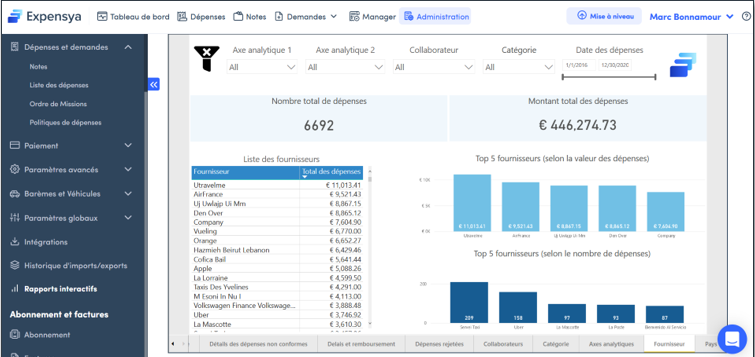
- Graphs (2)
- Dashboards (1)
- Tabs (3)
- Boxes
- Filters

- How to navigate through Expensya’s BI solution?
Expensya offers a seamless integration of standard dashboards for tracking and controlling data. These dashboards can be accessed directly from the "Administration" profile under the "Interactive Reports" section.
- How to read graphs?
10 dashboards are available on Expensya’s BI solution. Each one contains a variety of visuals and graphs. The most common ones are:
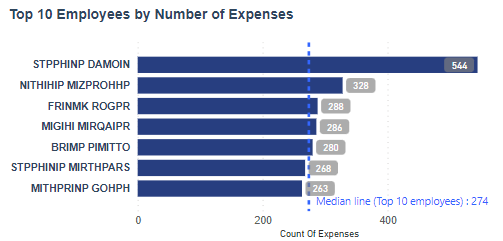
- Bar Charts: Ideal for comparing categories or showing trends over time.
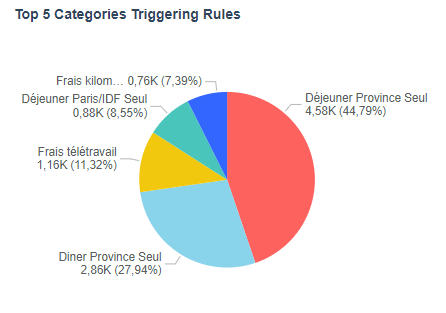
- Pie Charts: Display parts of a whole and are suitable for showcasing proportions.
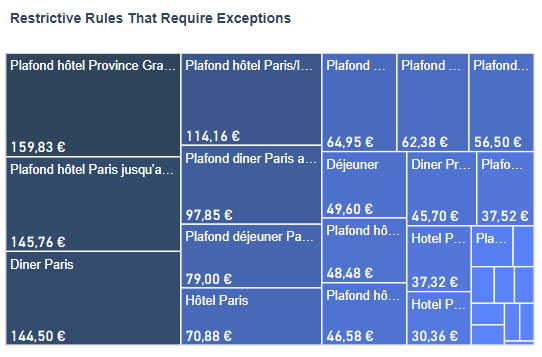
- Treemaps: charts of colored rectangles, with size representing value. The space inside each rectangle is allocated based on the value being measured.
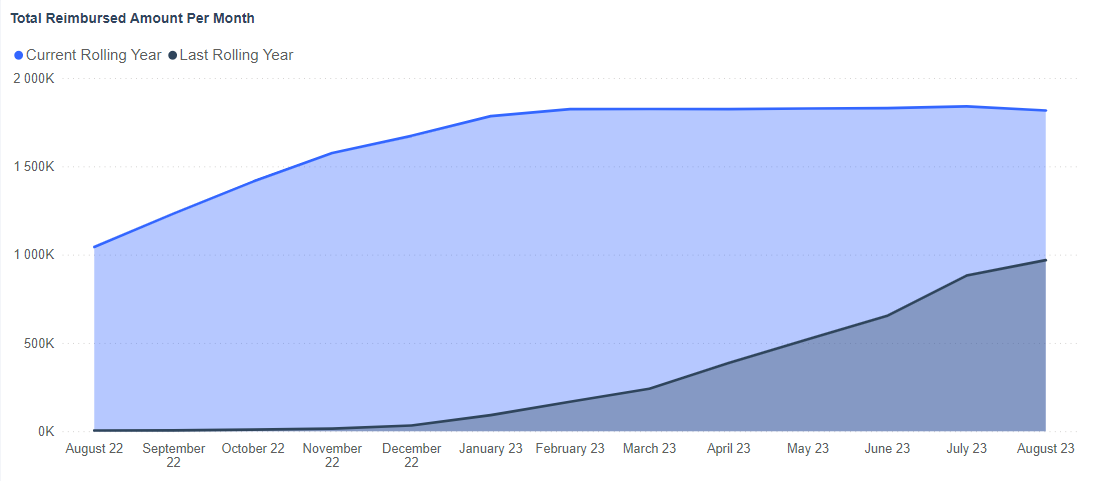
- Basic area charts: based on the line chart with the area between the axis and line filled in. They emphasize the magnitude of change over time and can be used to draw attention to the total value across a trend.
- How to use filters?
Filters are a crucial aspect of data exploration and analysis, as they enable you to drill down into specific subsets of data for deeper insights. Filters are created based on different criteria, such as time periods, categories, or geographic regions.
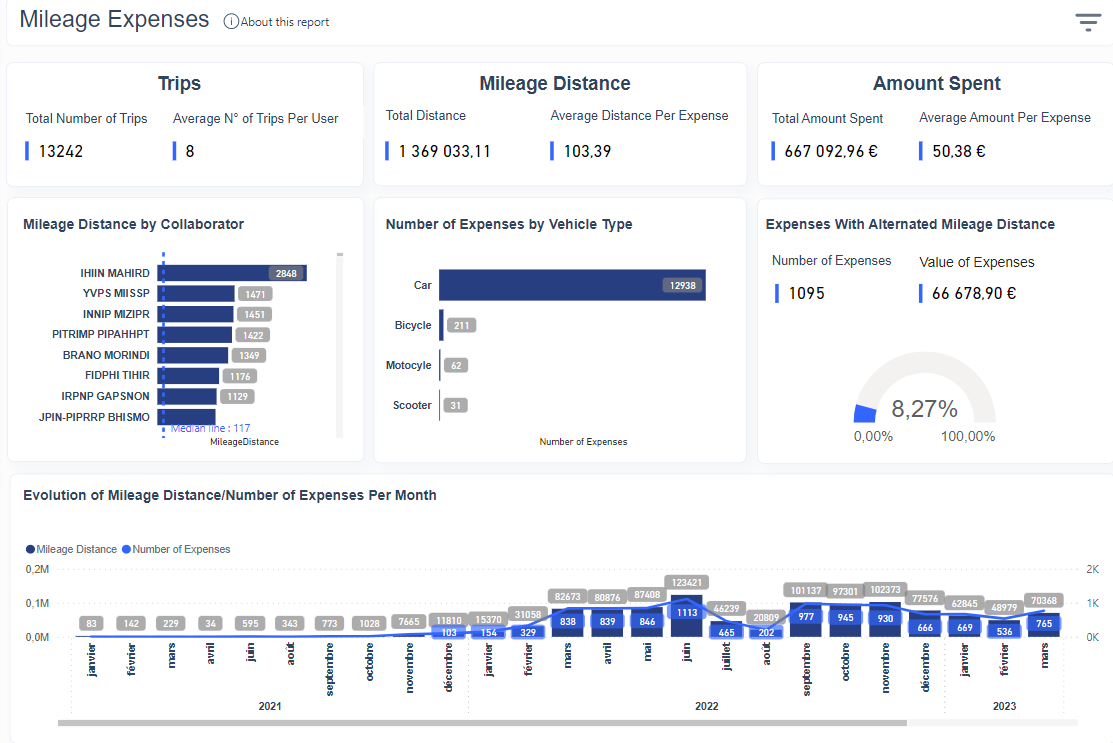
The advantages of filters can be clearly seen through a comparison between the same dashboard with and without filters.
- Without Filters:
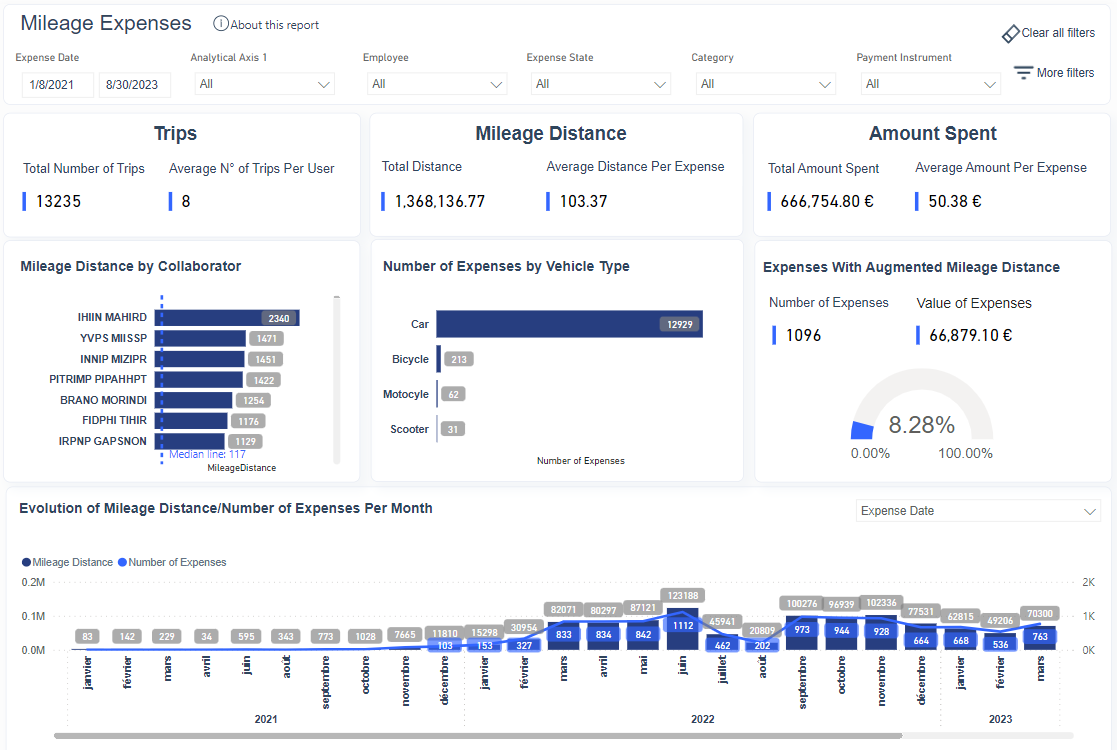
- With Filters:
We can clearly notice that filters facilitate:
- Data Exploration: Filters help you dive into specific aspects of your data, uncovering patterns and trends that might otherwise go unnoticed.
- Comparative Analysis: By filtering data, you can perform side-by-side comparisons of different subsets, facilitating more meaningful insights.
- Notifications and alerts:
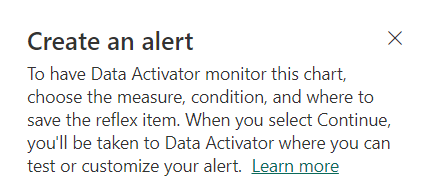
Data alerts can be used to notify you or a user that a specific data point is above, below, or at a specific threshold that you can set.
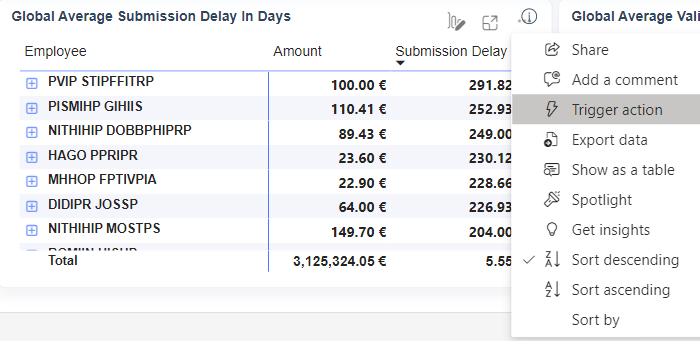
In order to configure an alert, select the ellipsis (...) in the corner of the tile you want to set an alert for and then select Trigger Action.
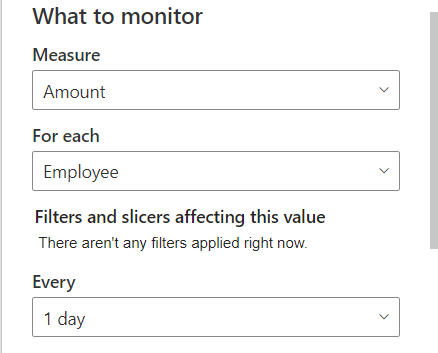
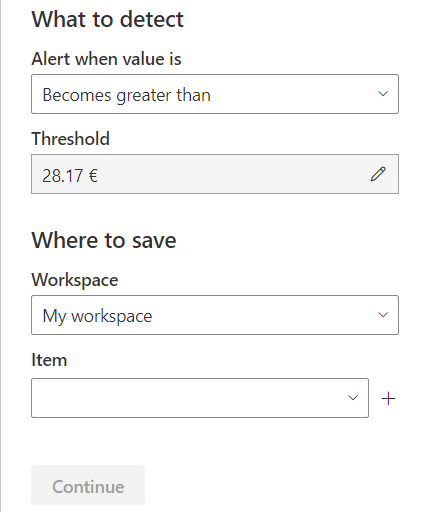
In the resulting window, set the measure and choose the threshold that you want to create the alert for, which includes options for above or below a specific threshold. Then, select at which frequency that you want the alerts to be sent. These alerts will be sent directly to your Notification Center in Expensya Insights Dashboards, but you can also configure emails to be sent to you if the threshold is crossed.
Alerts and notifications allow:
- Real-Time Monitoring: Notifications provide real-time updates, enabling you to respond promptly to critical changes or opportunities.
- Proactive Decision-Making: By receiving alerts, you can take proactive actions based on emerging trends or deviations from expected values.
- Quick Insights:
Quick Insights is a powerful feature within Expensya Insights dashboards that automatically uncovers patterns, trends, and correlations in your data. It can provide valuable insights without requiring extensive manual analysis.
Using Quick Insights:
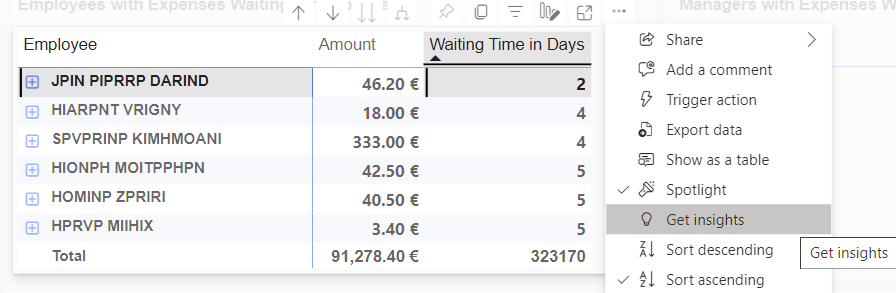
- Enabling Quick Insights: To enable Quick Insights, select a visualization and click on the "Get Insights" button. Expensya Insights dashboards will analyze the data and generate insights.
- Interpreting Insights: Quick Insights may identify trends, correlations, outliers, or anomalies in your data. It's important to understand the insights generated and assess their relevance to your analysis.
Benefits of Quick Insights:
- Time savings: Quick Insights accelerates the process of finding insights, allowing you to focus more on strategic analysis and decision-making.
- Discover hidden patterns: Quick Insights can uncover patterns that might have been overlooked in manual analysis, providing new perspectives on your data.